서론
NuScenes 데이터셋은 1,000개의 scene들로 이루어져있다.
이때 각 scene은 도로를 다니면서 수집된 약 20초 가량의 데이터들로 이루어져있다.
이번 포스팅은 scene을 구성하는 sample, 그 sample에 포함되는 bounding box들을 시각화 해본다.
구체적으로는 bounding box로 표현된 객체들을 카메라와 위에서 내려다보는 장면(Bird Eye View, BEV)으로 시각화 해볼 예정이다.
단순히 nuscenes devkit의 render_sample_data 메서드를 호출하는 포스팅이 아니다!
render_sample_data 를 scratch로 구현해보는 과정에 대한 정보를 담는다.
포스팅에서 사용하는 코드들은 다음 라이브러리가 설치되어야한다. (괄호 안에 있는 건 필자가 사용한 버전이다.)
- nuscenes-devkit (1.1.9)
- numpy (1.24.4)
- opencv-python (4.10.0.84)
- matplotlib (3.7.5)
그리고 당연히 nuscenes 데이터셋도 다운로드 되어있어야한다!
- trainval 버전을 사용하지만, mini버전에도 동일하게 적용할 수 있는 코드이므로 안심하길 바랍니다.

너무 길어진 코드들은 위와같이 생긴 접은글 로 표시했습니다.
더보기 버튼을 클릭하면 코드가 보입니다.
Bounding box는 어떻게 찾는가?
처음에 데이터셋을 보면, 특정 bounding box를 찾는것 조차 쉽지 않다.
특정 scene에 해당하는 bounding box는 annotation이라는 형태로 저장되어있다.
그럼 annotation은 어떻게 찾아야할까?
Nuscenes 홈페이지의 스키마를 통해 살짝이나마 유추해볼 수 있다.
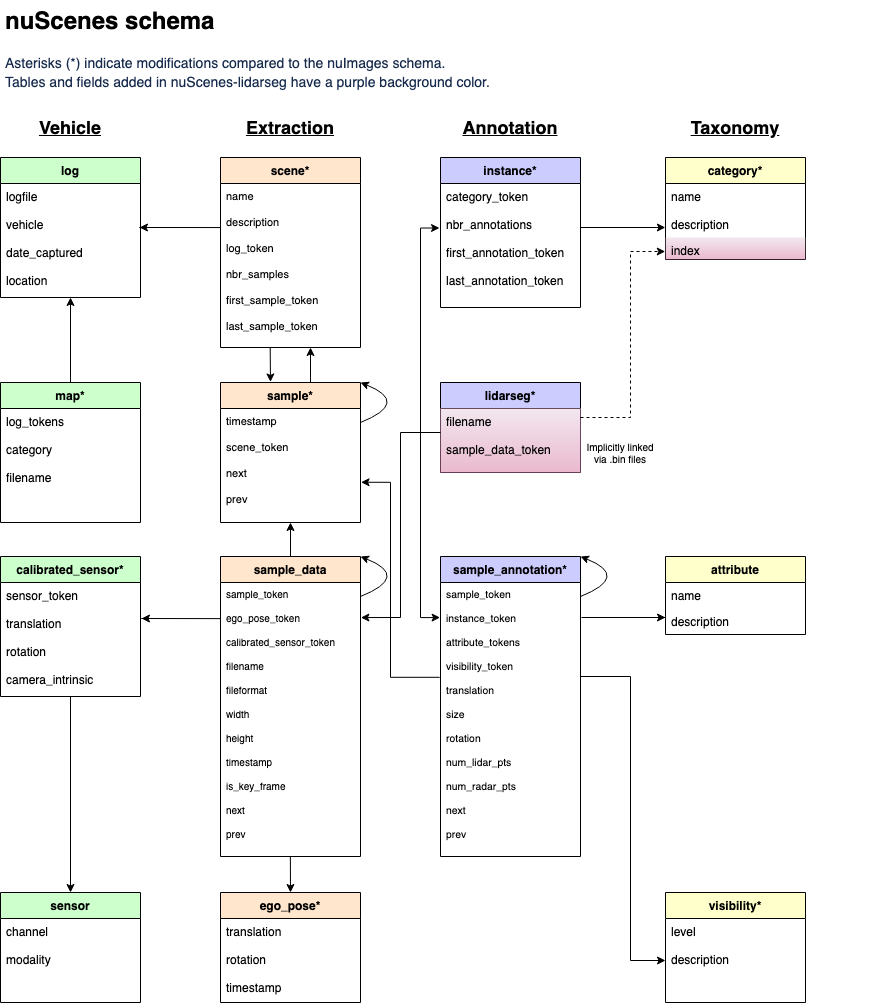
sample_annotation 이라는 테이블이 존재하므로 여기서 찾아낼 수 있다.
또한 어떤 sample에 해당하는 지 sample_token이라는 값으로 제공하기 때문에 테이블을 순회하면서 찾고자하는 토큰이랑 같은 annotation을 모두 긁어오면 된다.
여기서 한숨이 한번 나오는데, 다행히도 devkit에서는 테이블들을 reverse indexing해서 편의를 제공한다.
저 테이블들의 화살표가 모두 양방향으로 바뀐다고 생각하면 편하다.
결과적으로 특정 scene의 특정 sample의 annotation들을 찾으려면, scene --> sample --> annotation 순서로 접근해야된다는 것을 알 수 있다.
이제 직접 데이터를 확인해보자.
from nuscenes.nuscenes import NuScenes

nusc = NuScenes(version='v1.0-trainval', dataroot='./data/nuscenes', verbose=True)
위 코드를 통해 먼저 데이터를 인덱싱 해줘야한다.

우선 scene 테이블에서 첫번째 scene의 정보를 살펴보자.
보면 scene에 모든 데이터가 들어있는게 아니라, 몇가지를 제외하고는 모두 토큰으로 이루어져있다.
저 토큰은 필요한 데이터들이 들어있는 테이블의 key값이다.
다음으로 sample을 찾아야하기 때문에 sample token을 사용해야하는데, 문제가 발생한다.
first냐 last냐..
위 사진을 보면 알겠지만, scene에 40개의 sample이 있고 이 중 첫번째와 마지막 sample에 대한 토큰이 있는것이다.
우리는 편하게 첫번째 샘플을 사용하자.
first_sample_token = nusc.scene[0]["first_sample_token"]
first_sample = nusc.get("sample", first_sample_token)
nusc.get 은 첫번째 인자에 해당하는 테이블에서 두번째 인자에 해당하는 토큰을 가진 데이터를 가져오는 메서드다.
내용물을 잘 살펴보면, anns 라는 key가 보인다.
이 중 하나를 가져와서 annotation을 확인해보자.
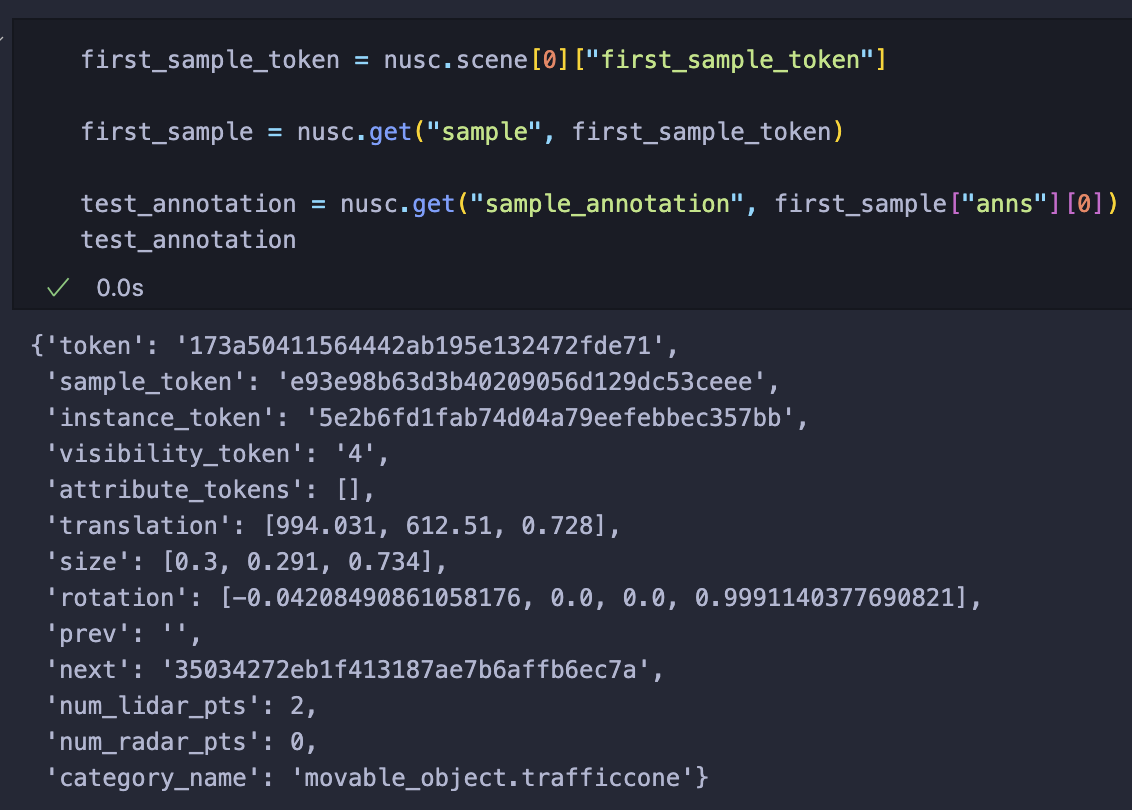
이렇게 우리는 첫번째 scnene의 첫번째 sample의 첫번째 bounding box를 찾게됐다.
시각화
Bounding box의 정보는 총 3가지로 이루어진다.
1. Translation : World 좌표계에서의 좌표
2. Size : Box의 크기 (width, length, height 순서)
3. Rotation : World 좌표계에서 회전된 정도 (Quaternion)
위 데이터들을 조합해서 bounding box를 만들어보자.
시각화 코드는 devkit을 100% 참고했기 때문에 링크를 남긴다. [코드]
먼저 박스를 구성하는 8개의 꼭짓점의 좌표를 만들어야한다.

빨간점은 박스의 앞면, 파란점은 박스의 뒷면에 해당하는 꼭짓점을 의미한다.
import numpy as np

test_annotation = nusc.get("sample_annotation", first_sample["anns"][0])

x_corner = test_annotation["size"][1] / 2 * np.array([1, 1, 1, 1,-1,-1,-1,-1])
y_corner = test_annotation["size"][0] / 2 * np.array([1,-1,-1, 1, 1,-1,-1, 1])
z_corner = test_annotation["size"][2] / 2 * np.array([1, 1,-1,-1, 1, 1,-1,-1])


점 위의 숫자는 각 box의 크기가 곱해지기 전의 꼭짓점 좌표 순서이다.
Box의 크기는 width, length, height 순서로 저장되어있고, 값들이 영향을 주는 축은 다음과 같다.
1. Width : y축
2. Length : x축
3. Height : z축
따라서 이에 맞춰 미리 정의한 꼭짓점에 2로 나누어 곱해준다.
이를 3D로 시각화 해보면 다음과 같다.

import matplotlib.pyplot as plt
from mpl_toolkits.mplot3d.art3d import Poly3DCollection

test_annotation = nusc.get("sample_annotation", first_sample["anns"][0])
print(test_annotation["category_name"])

x_corner = test_annotation["size"][1] / 2 * np.array([1, 1, 1, 1,-1,-1,-1,-1])
y_corner = test_annotation["size"][0] / 2 * np.array([1,-1,-1, 1, 1,-1,-1, 1])
z_corner = test_annotation["size"][2] / 2 * np.array([1, 1,-1,-1, 1, 1,-1,-1])

corners = np.stack([x_corner, y_corner, z_corner], axis=0) # (3, 8)

faces = [
    [corners[:,0], corners[:,1], corners[:,2], corners[:,3]], # front
    [corners[:,0], corners[:,1], corners[:,5], corners[:,4]], # top
    [corners[:,1], corners[:,2], corners[:,6], corners[:,5]], # left
    [corners[:,2], corners[:,3], corners[:,7], corners[:,6]], # bottom
    [corners[:,0], corners[:,3], corners[:,7], corners[:,4]], # right
    [corners[:,4], corners[:,5], corners[:,7], corners[:,6]], # back
]

fig = plt.figure(figsize=(10,5))
ax = fig.add_subplot(111, projection='3d')
ax.add_collection3d(Poly3DCollection(faces, color='cyan', alpha=0.3, edgecolor='black'))

ax.set_title("Original")

ax.set_box_aspect([1,1,1])

ax.set_xlim([corners[0,:].min()-0.5, corners[0,:].max()+0.5])
ax.set_ylim([corners[1,:].min()-0.5, corners[1,:].max()+0.5])
ax.set_zlim([corners[2,:].min()-0.5, corners[2,:].max()+0.5])

ax.set_xlabel('X')
ax.set_ylabel('Y')
ax.set_zlabel('Z')

plt.show()
박스의 뒷면을 강조하기 위해 면의 렌더링 순서를 꼬아서 X자로 만들었다.
만약 X자로 나오는게 거슬린다면, 4, 5, 6, 7 순서로 바꿔주면 된다.
참고로 위치가 제대로 안나오는데, 이유를 모르겠다..
이제 이 translation, rotation을 같이 적용해보자.
회전 값은 quaternion으로 되어있기 때문에 우리가 가진 3차원 좌표에 회전 변환을 시키려면 quaternion에서 회전 행렬로 변환해줘야한다.
다행스럽게도 pyquaternion 라이브러리가 내장으로 있기 때문에 바로 적용시킬 수 있다.
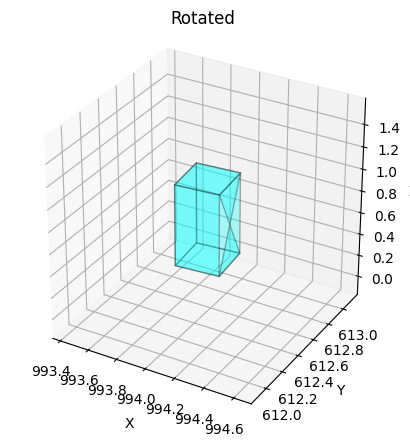
회전을 적용했다면, 좌표에 translation값을 더해서 위치를 이동시켜주자.
test_annotation = nusc.get("sample_annotation", first_sample["anns"][0])
print(test_annotation["category_name"])

x_corner = test_annotation["size"][1] / 2 * np.array([1, 1, 1, 1,-1,-1,-1,-1])
y_corner = test_annotation["size"][0] / 2 * np.array([1,-1,-1, 1, 1,-1,-1, 1])
z_corner = test_annotation["size"][2] / 2 * np.array([1, 1,-1,-1, 1, 1,-1,-1])

corners = np.stack([x_corner, y_corner, z_corner], axis=0) # (3, 8)

rotation_matrix = Quaternion(test_annotation["rotation"]).rotation_matrix

rotated_corners = rotation_matrix @ corners

rotated_corners[0,:] = rotated_corners[0,:] + test_annotation["translation"][0]
rotated_corners[1,:] = rotated_corners[1,:] + test_annotation["translation"][1]
rotated_corners[2,:] = rotated_corners[2,:] + test_annotation["translation"][2]

faces_rotated = [
    [rotated_corners[:,0], rotated_corners[:,1], rotated_corners[:,2], rotated_corners[:,3]], # front
    [rotated_corners[:,0], rotated_corners[:,1], rotated_corners[:,5], rotated_corners[:,4]], # top
    [rotated_corners[:,1], rotated_corners[:,2], rotated_corners[:,6], rotated_corners[:,5]], # left
    [rotated_corners[:,2], rotated_corners[:,3], rotated_corners[:,7], rotated_corners[:,6]], # bottom
    [rotated_corners[:,0], rotated_corners[:,3], rotated_corners[:,7], rotated_corners[:,4]], # right
    [rotated_corners[:,4], rotated_corners[:,5], rotated_corners[:,7], rotated_corners[:,6]], # back
]

fig = plt.figure(figsize=(10,5))
ax = fig.add_subplot(111, projection='3d')
ax.add_collection3d(Poly3DCollection(faces_rotated, color='cyan', alpha=0.3, edgecolor='black'))

ax.set_title("Rotated")

ax.set_box_aspect([1,1,1])

ax.set_xlim([rotated_corners[0,:].min()-0.5, rotated_corners[0,:].max()+0.5])
ax.set_ylim([rotated_corners[1,:].min()-0.5, rotated_corners[1,:].max()+0.5])
ax.set_zlim([rotated_corners[2,:].min()-0.5, rotated_corners[2,:].max()+0.5])

ax.set_xlabel('X')
ax.set_ylabel('Y')
ax.set_zlabel('Z')

plt.show()
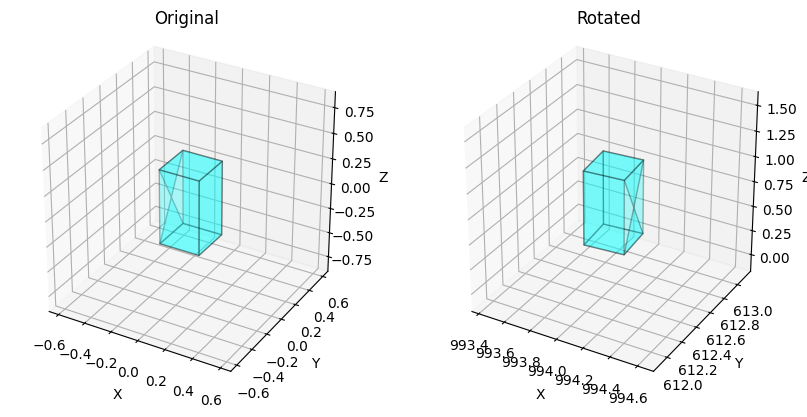
같이 보면 위와 같다.
0번째는 traffic cone이고 2번째는 truck이다.
번호만 2번으로 바꾸면 아래와 같이 더 극적으로 회전이 들어간 결과를 볼 수 있다.

위 결과를 종합해서 annotation으로부터 8개의 꼭짓점을 뽑을 수 있도록 Box3D 클래스를 만들어보자.
class Box3D:
    def __init__(self, annotation:dict):
        self.wlh:np.ndarray = np.array(annotation["size"])
        self.orientation:Quaternion = Quaternion(annotation["rotation"])
        self.center:np.ndarray = np.array(annotation["translation"])

    def corners(self):
        width, length, height = self.wlh

        x_corner = length / 2 * np.array([1,  1,  1,  1, -1, -1, -1, -1])
        y_corner = width  / 2 * np.array([1, -1, -1,  1,  1, -1, -1,  1])
        z_corner = height / 2 * np.array([1,  1, -1, -1,  1,  1, -1, -1])

        corners = np.stack([x_corner, y_corner, z_corner], axis=0) # (3, 8)

        rotated_corners = self.orientation.rotation_matrix @ corners # (3, 8)

        rotated_corners[0,:] = rotated_corners[0,:] + self.center[0]
        rotated_corners[1,:] = rotated_corners[1,:] + self.center[1]
        rotated_corners[2,:] = rotated_corners[2,:] + self.center[2]

        return rotated_corners
BEV로 랜더링
BEV(Bird Eye View)는 새의 시점에서 본다는 말로 3D 객체들을 위에서 내려다보는 것을 의미한다.
한번에 이해하기 위해 다음과 같은 코드를 돌려보자.
first_sample_token = nusc.scene[0]["first_sample_token"]
first_sample = nusc.get("sample", first_sample_token)
first_sample_data_tokens = first_sample["data"]

nusc.render_sample_data(first_sample_data_tokens["LIDAR_TOP"], axes_limit=60)

위 이미지는 LiDAR 데이터와 bounding box들을 랜더링한 결과다.
위에서 내려보는 시점으로 객체들을 파악할 수 있다는 장점이 있다.
지금부터 설명할 BEV 랜더링은 LiDAR 데이터까지는 랜더링하지 않고, bounding box의 윗면만 그려내어 표시해볼 예정이다.
Bounding box의 translation이나 size 값들로 어렴풋이 이해했을 수도 있겠지만, 값들은 모두 실제 위치와 크기 기준으로 만들어졌다는 것을 알아두자.
Ego pose에 대해
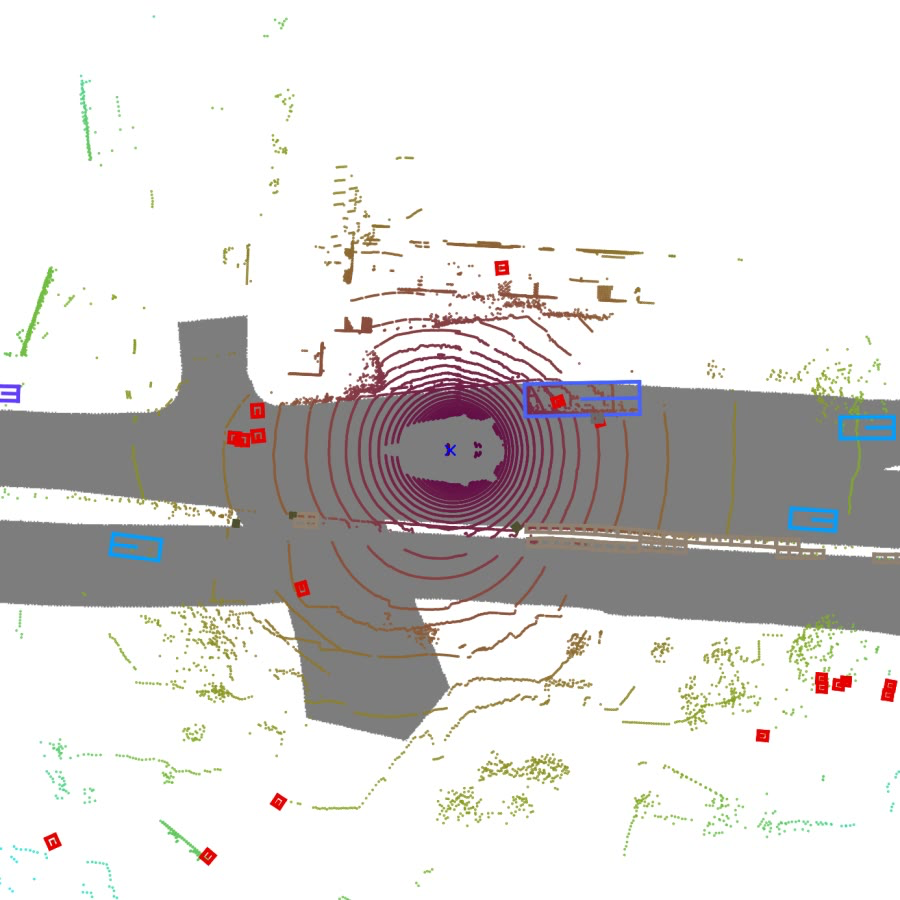

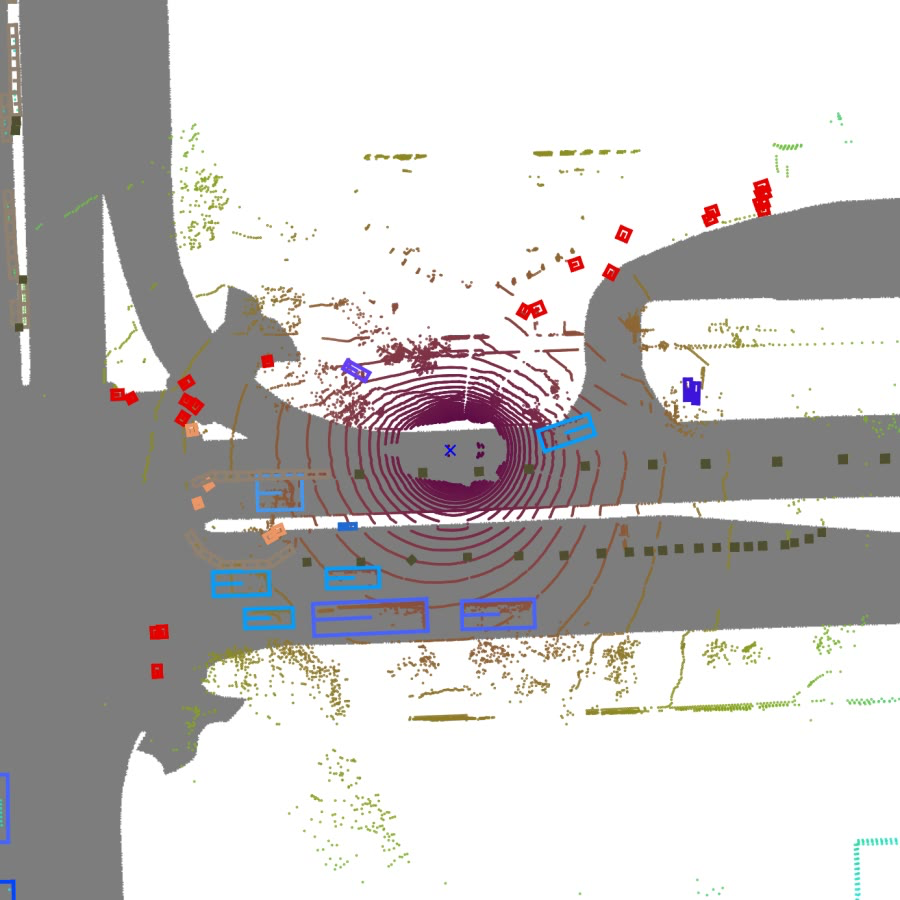
코드 작성시 나타날 ego pose에 대해 예방주사를 놓으려한다.
Ego vehicle 이란게 있다.
각 이미지들 정중앙에 보이는 자동차(파란색 X 표시)를 ego vehicle이라고 하며, 랜더링시 항상 맵의 중심에서 가로선과 평행하고 오른쪽을 보고있다.
위 이미지들 같이 scene에 존재하는 모든 sample의 LiDAR의 랜더링 결과를 쌓아서 동영상을 만들어보면, ego vehicle은 가만히 있고, 주변 사물들이 움직인다는 것을 알 수 있다.
앞서 설명했던 내용들을 잘 떠올려보면, bounding box들은 이미 정해진 위치, 크기 그리고 회전이 있다.
근데 랜더링 결과는 ego vehicle을 중심으로 돌아간다는 것은 무엇을 의미할까?
Ego vehicle과 관련된 값이 bounding box에 영향을 미친다는 것이며, 랜더링은 다음과 같은 순서로 적용된다는 것이다.
1. Bounding box 자체의 위치 + 크기 + 회전
2. Ego vehicle에 맞춰 위치조정 및 회전 (ego pose)
결국 ego pose는 sensor들(카메라, LiDAR, Radar)이 수집한 데이터를 ego vehicle에 맞춰서 랜더링할 수 있게 도와주는 값이다.
- 즉 모든 sensor의 데이터가 ego vehicle을 중심으로 동기화될 수 있다.
이를 통해 nuscenes는 sensor가 데이터를 수집하는 시점에 ego pose가 동시에 기록되도록 했다는 것을 알 수 있다.
- 그러나 sensor마다 수집되는 시기가 다르므로 같은 sample에 존재하는 sample data라 해도 ego pose가 다를 수 있다. (실제로 값을 까보면 모두 조금씩 다르다.)
이런 부분을 이해한 뒤, 코드를 작성해보도록 하자.
시각화
BEV로 bounding box를 보기 위해서는 LiDAR의 ego pose가 필요하다.
sample_token = nusc.scene[0]["first_sample_token"]
sample = nusc.get("sample", sample_token)
sample_data_tokens = sample["data"]

sample_data = nusc.get("sample_data", sample_data_tokens["LIDAR_TOP"])

ego_pose = nusc.get("ego_pose", sample_data["ego_pose_token"])
위와같이 얻어낼 수 있다.
ego_rotation_qt = Quaternion(ego_pose["rotation"])
ego_translate = ego_pose["translation"]
그리고 위와같이 ego vehicle의 위치 및 회전 정보를 알아낼 수 있다.
앞서 말했듯 bounding box에 ego vehicle의 위치와 회전 정보로 조정을 시켜야한다.
따라서 bounding box 클래스(Box3D)를 수정하자.
class Box3D:
    def __init__(self, annotation):
        self.wlh:np.ndarray = np.array(annotation["size"])
        self.orientation:Quaternion = Quaternion(annotation["rotation"])
        self.center:np.ndarray = np.array(annotation["translation"])

    def rotate(self, rotation:Quaternion):
        self.center = rotation.rotation_matrix @ self.center
        self.orientation = rotation * self.orientation

    def translate(self, translation):
        self.center[0] = self.center[0] + translation[0]
        self.center[1] = self.center[1] + translation[1]
        self.center[2] = self.center[2] + translation[2]

    def corners(self):
        width, length, height = self.wlh

        x_corner = length / 2 * np.array([1,  1,  1,  1, -1, -1, -1, -1])
        y_corner = width  / 2 * np.array([1, -1, -1,  1,  1, -1, -1,  1])
        z_corner = height / 2 * np.array([1,  1, -1, -1,  1,  1, -1, -1])

        corners = np.stack([x_corner, y_corner, z_corner], axis=0) # (3, 8)

        rotated_corners = self.orientation.rotation_matrix @ corners # (3, 8)

        rotated_corners[0,:] = rotated_corners[0,:] + self.center[0]
        rotated_corners[1,:] = rotated_corners[1,:] + self.center[1]
        rotated_corners[2,:] = rotated_corners[2,:] + self.center[2]

        return rotated_corners
추가된 것은 translation과 rotation 부분이다.
이제 bounding box들을 모두 Box3D 객체로 만들어주자.
test_boxes = [Box3D(nusc.get("sample_annotation", ann)) for ann in sample["anns"]]
그리고 ego pose를 통해 위치와 회전을 조정해야하는데, 이 조정에 대해 자세히 알아보자.
- Ego vehicle 기준으로 위치를 맞춘다는 것은 ego vehicle이 원점에 있다고 가정하고 이루어진다.
- 따라서 모든 box의 위치에서 ego vehicle의 위치 값을 빼줌으로써 원점 중심으로 이동시킨다.
- Ego vehicle 기준으로 회전을 맞춘다는 것은 ego vehicle의 회전각도를 0도로 돌린다는 것이다.
- 따라서 모든 box의 회전각도에서 ego vehicle의 회전각도를 빼줘야한다.
우리는 BEV로 보기때문에 z축으로의 회전(yaw)만 고려하고, x나 y축으로의 회전(roll, pitch)은 고려하지 않는다.
따라서 모든 box의 위 내용을 적용시키면 아래와 같다.
yaw = ego_rotation_qt.yaw_pitch_roll[0]

ego_related_boxes_corners = []
for test_box in test_boxes:
    test_box.translate(-np.array(ego_translate))
    test_box.rotate(Quaternion(scalar=np.cos(yaw/2), vector=[0, 0, np.sin(yaw/2)]).inverse)

    ego_related_boxes_corners.append(test_box.corners())

ego_related_boxes_corners = np.stack(ego_related_boxes_corners, axis=0)
회전이 quaternion으로 표현됐다는 것에 유의하자.
이제 cv2 로 랜더링 할 예정이기 때문에 좌표들이 음수가 되지 않도록 해야한다.
boxes_minimum_coordinates = [ego_related_boxes_corners[:,0,:].min(), ego_related_boxes_corners[:,1,:].min()]

ego_related_boxes_corners[:,0,:] = ego_related_boxes_corners[:,0,:] - boxes_minimum_coordinates[0]
ego_related_boxes_corners[:,1,:] = ego_related_boxes_corners[:,1,:] - boxes_minimum_coordinates[1]
각 좌표들의 최소값으로 조정했기 때문에 ego vehicle의 위치는 boxes_minimum_coordinates 를 양수로 바꾼 값과 같다.
이제 그려보자
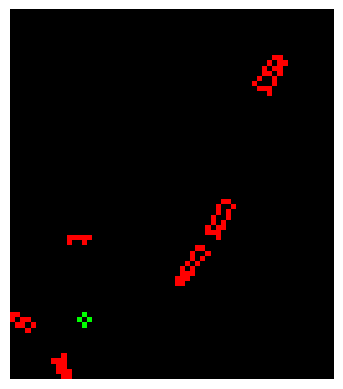
import cv2

plane = np.zeros((int(ego_related_boxes_corners[:,1,:].max()+10), int(ego_related_boxes_corners[:,0,:].max()+10), 3), np.uint8)

for box in ego_related_boxes_corners:
    top_side = box[:,[0,1,5,4]] # (3,4)

    front_center = np.mean(top_side[:,:2], axis=1) # (2,1)
    box_center = np.mean(top_side, axis=1) # (2,1)

    # point = (x_n, y_n)
    # [(x_0, x_1), (y_0, y_1)]
    lines = [[[top_side[0,0], top_side[0,1]], [top_side[1,0], top_side[1,1]]], # front
             [[top_side[0,1], top_side[0,2]], [top_side[1,1], top_side[1,2]]], # left
             [[top_side[0,2], top_side[0,3]], [top_side[1,2], top_side[1,3]]], # back
             [[top_side[0,3], top_side[0,0]], [top_side[1,3], top_side[1,0]]], # right
             [[front_center[0], box_center[0]], [front_center[1], box_center[1]]]] # front-center to box-center (orientation)

    lines = np.array(lines, dtype = np.int32)
    for line in lines:
        cv2.line(plane, (line[0][0], line[1][0]), (line[0][1], line[1][1]), color=(255,0,0), thickness=1)

cv2.circle(plane, (-int(boxes_minimum_coordinates[0]), -int(boxes_minimum_coordinates[1])), 1, color=(0,255,0), thickness=1)
plt.axis("off")
plt.imshow(plane[::-1])
참고로 그림의 위아래를 반전시켰는데(plt.imshow(plane[::-1])) BEV 결과랑 똑같이 만들기 위함이다.
- 이는 이미지가 왼쪽 위를 원점으로 잡는 것과 다르게 LiDAR는 왼쪽 아래가 원점이기 때문이다.


위에서 본 그림과 비교했을때, 위치는 제대로 나왔지만 점들간의 차이가 너무 작아서 못생기게 나와버렸다.
따라서 점들 사이를 벌려주자.

map_ratio = 16

ego_related_boxes_corners[:,:2,:] = ego_related_boxes_corners[:,:2,:] * map_ratio # For better looking

boxes_minimum_coordinates = [ego_related_boxes_corners[:,0,:].min(), ego_related_boxes_corners[:,1,:].min()]

ego_related_boxes_corners[:,0,:] = ego_related_boxes_corners[:,0,:] - boxes_minimum_coordinates[0]
ego_related_boxes_corners[:,1,:] = ego_related_boxes_corners[:,1,:] - boxes_minimum_coordinates[1]

plane = np.zeros((int(ego_related_boxes_corners[:,1,:].max()+10), int(ego_related_boxes_corners[:,0,:].max()+10), 3), np.uint8)

for box in ego_related_boxes_corners:
    top_side = box[:,[0,1,5,4]] # (3,4)

    front_center = np.mean(top_side[:,:2], axis=1) # (2,1)
    box_center = np.mean(top_side, axis=1) # (2,1)

    # point = (x_n, y_n)
    # [(x_0, x_1), (y_0, y_1)]
    lines = [[[top_side[0,0], top_side[0,1]], [top_side[1,0], top_side[1,1]]], # front
             [[top_side[0,1], top_side[0,2]], [top_side[1,1], top_side[1,2]]], # left
             [[top_side[0,2], top_side[0,3]], [top_side[1,2], top_side[1,3]]], # back
             [[top_side[0,3], top_side[0,0]], [top_side[1,3], top_side[1,0]]], # right
             [[front_center[0], box_center[0]], [front_center[1], box_center[1]]]] # front-center to box-center (orientation)

    lines = np.array(lines, dtype = np.int32)
    for line in lines:
        cv2.line(plane, (line[0][0], line[1][0]), (line[0][1], line[1][1]), color=(255,0,0), thickness=int(map_ratio*0.3) if int(map_ratio*0.3) > 0 else 1)

cv2.circle(plane, (-int(boxes_minimum_coordinates[0]), -int(boxes_minimum_coordinates[1])), map_ratio, color=(0,255,0), thickness=int(map_ratio*0.3) if int(map_ratio*0.3) > 0 else 1)
plt.axis("off")
plt.imshow(plane[::-1])
그럼 위와같은 그림이 나오게 된다.
LiDAR 랜더링과 비교하면 색깔이나 LiDAR 데이터등 부족한게 많지만, 그래도 BEV를 성공했다.
카메라로 랜더링
카메라는 BEV와 비교해서 고려할게 두개 더 있다.
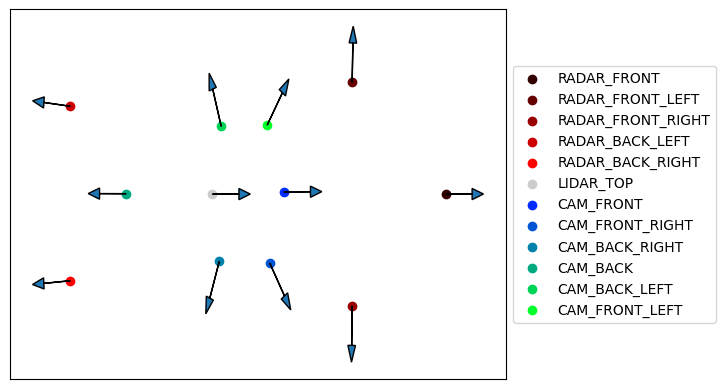
첫 번째는 카메라 외부 요인(extrinsic)으로 카메라의 위치와 회전이다.

위 이미지를 보면, 모든 카메라가 자동차와 같은 방향을 바라보지 않는다는 것을 알 수 있다.
첫번째 scene의 sensor들의 위치와 방향을 시각화 해보자.
first_sample_token = nusc.scene[0]["first_sample_token"]
first_sample = nusc.get("sample", first_sample_token)
first_sample_data_tokens = first_sample["data"]

first_sample_datas = [nusc.get("sample_data", t) for t in first_sample_data_tokens.values()]

first_sample_cs_records = [nusc.get("calibrated_sensor", v["calibrated_sensor_token"]) for v in first_sample_datas]
first_sample_sensors_location = [v["translation"] for v in first_sample_cs_records]
first_sample_sensors_location = np.stack(first_sample_sensors_location)

first_sample_sensors_rotation = [Quaternion(v["rotation"]) for v in first_sample_cs_records]

first_sample_sensors_orientation = []
for idx, rotation in enumerate(first_sample_sensors_rotation):
    rm = rotation.rotation_matrix
    if idx < 5: # Radar
        rm = rotation.rotation_matrix @ np.array([1, 0, 0]).T
        first_sample_sensors_orientation.append([rm[0], rm[1]])
    elif idx < 6: # LiDAR
        rm = rotation.rotation_matrix @ np.array([0, 1, 0]).T
        first_sample_sensors_orientation.append([rm[0], rm[1]])
    else: # Camera
        rm = rotation.rotation_matrix @ np.array([0, 0, 1]).T
        first_sample_sensors_orientation.append([rm[0], rm[1]])

labels = [v["channel"] for v in first_sample_datas]

colors = []
for i in range(len(labels)):
    if i < 5: # Radar
        colors.append([0.2 * (i+1), 0, 0])
    elif i < 6: # LiDAR
        colors.append([0.8, 0.8, 0.8])
    else: # Camera
        colors.append([0, (1/6) * (i-5), (1/6) * (7-(i-5))])

for loc, ori, c, l in zip(first_sample_sensors_location, first_sample_sensors_orientation, colors, labels):
    ori = np.array(ori)
    ori = ori / (np.sum(ori**2) ** 0.5)
    plt.scatter(loc[0], loc[1], color=c, label=l)
    plt.arrow(loc[0], loc[1], ori[0]*0.4, ori[1]*0.4, length_includes_head=True, head_width=0.08)

plt.legend(loc='center left', bbox_to_anchor=(1, 0.5))
plt.xticks([])
plt.yticks([])
plt.show()
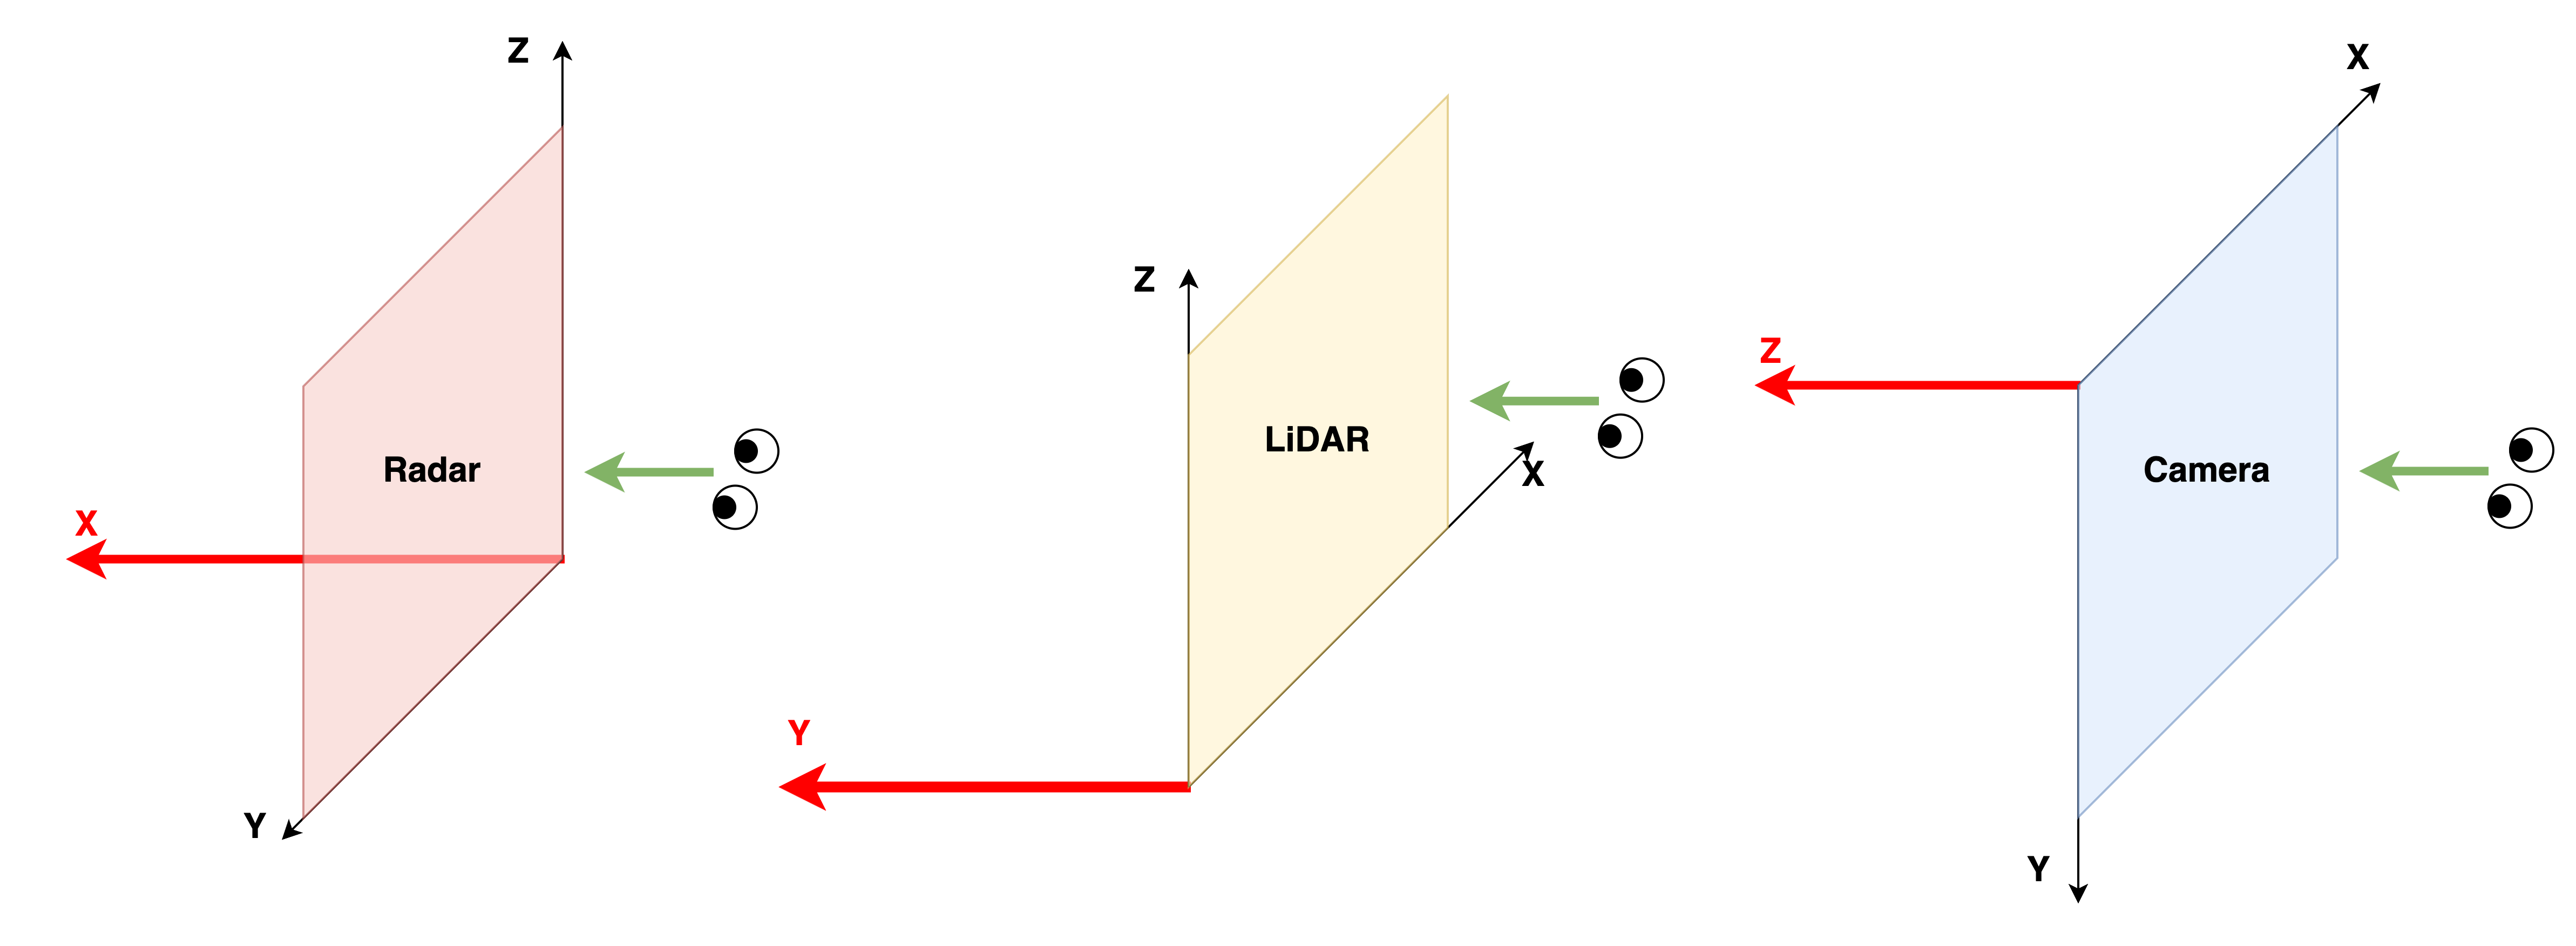
코드 중 방향에 대한 설명을 해보자면, 각 센서마다 좌표계가 다르다는 것이 고려됐다. (위의 자동차 이미지를 같이 보자)
- Radar의 방향 : x축
- LiDAR의 방향 : y축
- Camera의 방향 : z축
시각화 결과를 보면 알겠지나 calibrated_sensor 값을 통해 ego vehicle 기준으로 sensor들이 어디에 위치하고, 어디를 바라보는지 알 수 있다.
따라서 렌더링 시, 이 부분을 고려해야한다.
두 번째는 카메라의 내부 요인(intrinsic)으로 자세히 말하자면, 카메라의 센서와 렌즈 사이의 관계이다.
이는 camera intrinsic이라 부르며, 3차원 좌표를 이미지 좌표(픽셀 단위)로 사영(projection)시키는 역할을 한다.
최종적으로 bounding box를 카메라로 렌더링하는 것은 다음과 같은 순서로 진행된다.
1. Bounding box 자체의 위치 + 크기 + 회전
2. Ego vehicle에 맞춰 위치조정 및 회전 (ego pose)
3. 카메라 외부 요인에 맞춰 위치조정 및 회전 (Camera extrinsic)
4. 카메라 내부 요인에 맞춰 사영
이제 시각화를 진행해보자.
시각화
시각화는 첫번째 scene의 앞의 왼쪽 카메라(CAM_FRONT_LEFT)를 기준으로 진행한다.
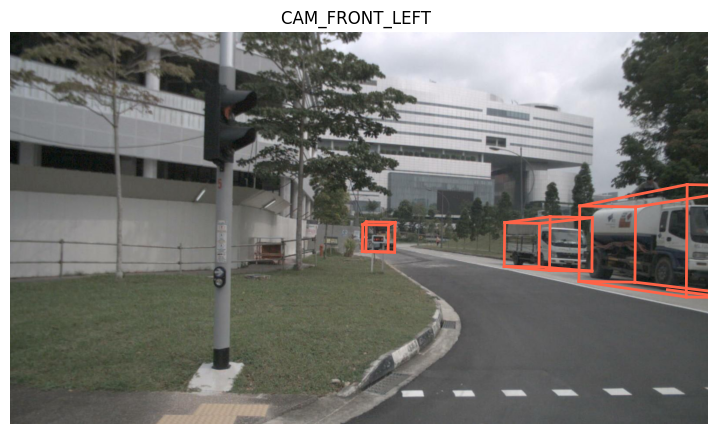
따라서 위와 비슷한 결과를 만들 예정이다.
first_sample_token = nusc.scene[0]["first_sample_token"]
first_sample = nusc.get("sample", first_sample_token)
first_sample_data_tokens = first_sample["data"]

first_sample_data = nusc.get("sample_data", first_sample_data_tokens["CAM_FRONT_LEFT"])

ego_pose = first_sample_data["ego_pose_token"]
ego_pose_data = nusc.get("ego_pose", ego_pose)

sensor_calibration = nusc.get("calibrated_sensor", first_sample_data["calibrated_sensor_token"])
먼저 필요한 정보들을 가져오자.
test_boxes = [Box3D(nusc.get("sample_annotation", ann)) for ann in first_sample["anns"]]

reversed_test_boxes = []

for test_box in test_boxes:
    # Ego transform
    test_box.translate(-np.array(ego_pose_data["translation"]))
    test_box.rotate(Quaternion(ego_pose_data["rotation"]).inverse)

    # Sensor transform
    test_box.translate(-np.array(sensor_calibration["translation"]))
    test_box.rotate(Quaternion(sensor_calibration["rotation"]).inverse)

    reversed_test_boxes.append(test_box.corners())
이후 박스들을 위에서 만들었던 Box3D 객체로 만들어준 뒤, 앞서 설명했던 렌더링 순서에 맞춰 bounding box의 위치와 회전을 조정한다.
projected_boxes = []

view = np.eye(4)
view[:3,:3] = sensor_calibration["camera_intrinsic"]

for r_test_box in reversed_test_boxes:
    r_box_corners = np.concatenate([r_test_box, np.ones((1, r_test_box.shape[1]))], axis=0)

    projected_corners = view @ r_box_corners # (4, N)
    projected_corners = projected_corners[:3,:]

    # Normalize
    projected_corners = projected_corners / projected_corners[2:3,:]

    is_visible_in_width     = np.logical_and(projected_corners[0,:] > 0, projected_corners[0,:] < first_sample_data["width"])
    is_visible_in_height    = np.logical_and(projected_corners[1,:] > 0, projected_corners[1,:] < first_sample_data["height"])
    is_visible              = np.logical_and(is_visible_in_width, is_visible_in_height)
    is_visible              = np.logical_and(is_visible, r_test_box[2,:] > 0)

    if any(is_visible):
      projected_boxes.append(projected_corners)
이후 이미지 위로 사영(projection)시킨다.
이때 box의 8개의 좌표는 다음 조건들을 만족해야한다.
- 이미지 안에 위치하는가? (사영된 좌표)
- 카메라 앞에 위치하는가? (사영되기 전 z좌표가 양수, 이미지는 z축이 양의 방향으로 뻗어나가는 좌표계)
따라서 위 조건들을 하나라도 만족하는 박스를 랜더링한다.
- any 함수는 boolean 배열을 순회해서 하나라도 True값이 있으면, 반환값이 True이다.

plane = cv2.imread("./data/nuscenes/" + first_sample_data["filename"])

for box in projected_boxes:
    box = box.astype(np.int32)
    lines = []

    # front
    for i in range(4):
        line = []
        start_point = [box[0,i], box[1,i]]
        end_point = [box[0, (i+1)%4], box[1, (i+1)%4]]

        line.append(start_point)
        line.append(end_point)
        lines.append(line)

    # side(x-axis horizontal)
    for i in range(4):
        line = []
        start_point = [box[0,i], box[1,i]]
        end_point = [box[0, i+4], box[1, i+4]]

        line.append(start_point)
        line.append(end_point)
        lines.append(line)

    # back
    for i in range(4):
        line = []
        start_point = [box[0,i+4], box[1,i+4]]
        end_point = [box[0, ((i+1)%4) + 4], box[1, ((i+1)%4) +4 ]]

        line.append(start_point)
        line.append(end_point)
        lines.append(line)

    for idx, line in enumerate(lines):
        if idx < 4:
            cv2.line(plane, line[0], line[1], color=(0,255,0), thickness=5)
        else:
            cv2.line(plane, line[0], line[1], color=(255,0,0), thickness=5)

plt.figure(figsize=(10,5))
plt.axis("off")
plt.imshow(plane)
앞면의 모서리는 초록색으로 색칠했다.
굳이 nusc.render_sample_data 방식으로 방향을 표시하지 않은 이유는 내 방식이 카메라 상에서는 방향을 더 잘 나타낸다고 생각하기 때문이다.

